
Background
Terra is the flagship of NASA’s Earth Observing System (EOS). It was launched into orbit on December 18, 1999 and carries five instruments: the Moderate-resolution Imaging Spectroradiometer (MODIS), the Multi-angle Imaging SpectroRadiometer (MISR), the Advanced Spaceborne Thermal Emission and Reflection Radiometer (ASTER), the Clouds and Earth’s Radiant Energy System (CERES), and the Measurements of Pollution in the Troposphere (MOPITT). The mission remains healthy, and continues to enable scientists to address fundamental questions in Earth sciences. Terra is currently one of the longest single-platform satellite record for studying Earth, making it one of our most valuable satellite record for examining Earth’s climate and climate change. It is also amongst the most popular NASA EOS datasets, serving not just the scientific community, but also government, commercial, and educational communities.
NASA documents dating back to the beginning of the EOS era have indicated that the selection of these five instruments for Terra were based, in part, on the potential for obtaining greater quality of information for Earth Science through the synergistic use (data fusion) of the five instruments compared to individual instruments alone. But investigators wanting to make use of radiometric data (Level 1) from multiple Terra instruments run into numerous challenges, including (1) the the storage of different instrument data at different locations, in different file formats with different granularity, and in different projections, (2) the lack of consistency between instruments in packing radiometric, geolocation, sun-view geometry, and time information within its data files, (3) the growing volume of data (now over a petabyte and increasing at a rate of close to 2TB a day), (4) and the inadequate cyberinfrastructure to tackle whole-mission data fusion and mining problems, including difficulties in transferring and managing the data at mission-scales, and (5) the range of expertise needed to tackle these problems at an investigator’s institution are often not available.
The Terra Fusion project mitigates these problems by generating Level 1 Terra Basic Fusion files that are ease to use, available on public platforms, and producing an open source advanced fusion toolkit – all with full documentation.
We have created a 2.4 PB (and growing) dataset of Level 1 Terra Basic Fusion files. Each Level 1 Terra Basic Fusion file contains one full Terra orbit of data and is typically 15 – 40 GB in size, depending on how much data was collected for that orbit. This covers all orbits collected from 2000 – 2015. It contains instrument radiance in physical units; radiance quality indicator; geolocation for each IFOV at its native resolution; sun-view geometry; observation time; and other attributes/metadata. It is stored in HDF5, conformed to CF conventions, and accessible by netCDF-4 enhanced models. It’s naming convention follows: TERRA_BF_L1B_OXXXX_YYYYMMDDHHMMSS_F000_V000.h5
The Algorithm Theoretical Basis Document for the Level 1 Terra Basic Fusion product is published here:
http://go.illinois.edu/terra-fusion-doc
The ATBD and other other documentations can also be found on the projects GitHub:
https://github.com/TerraFusion
Access to Data
The Level 1 Terra Basic Fusion Files are available at three locations:
- AWS Public Dataset Program, https://registry.opendata.aws
- Open Storage Network, https://www.openstoragenetwork.org
- An AWS bucket on glacier managed by NASA
- National Center for Supercomputing Applications (NCSA), http://www.ncsa.illinois.edu
The three locations offer different capabilities depending on your needs.
1. The AWS cloud offers the ability to run your code beside the data, along with other cloud services you may wish to use. The AWS Public Dataset Program on has graciously agreed to host ~150 TB of Level 1 Terra Basic Fusion files on S3. Because this is about 6% of the total mission volume, we made choices as to which WRS-2 paths (full orbit) to include for the mission to facilitate time series analysis. These paths are Paths 20-26 (e.g., US corn belt), 108 (e.g., Japan), 125 (e.g., China), 143 (e.g., India), 150 (e.g., Showa Station, Antarctica), 169 (e.g., Europe and Africa), 188 (e.g., Nigeria calibration site), and 233 (e.g., Greenland). Downloadable URLs to these files are listed here. You can copy one specific orbit in the AWS cloud using its URL via any data transferring tools such as wget, e.g., for Orbit 10204:
wget --input-file=https://terrafusiondatasampler.s3.us-west-2.amazonaws.com/P108/TERRA_BF_L1B_O10204_20011118010522_F000_V001.h5
2. The Open Storage Network (OSN) offers the ability to download the data for free. The OSN has also graciously agreed to host ~150 TB of Level 1 Terra Basic Fusion files. Because this is about 6% of the total mission volume, we made choices as to which WRS-2 paths (full orbit) to include for the mission to facilitate time series analysis, and avoided (but not completely because of popularity of paths) duplicating what we placed on the AWS Public Dataset Program. The paths on OSN are Paths 11-14 (e.g., Bermuda), 108 (e.g., Greenland), 123-126 (e.g., all of China), 143-147 (e.g., all of India), and 233 (e.g., Greenland). You can identify Terra fusion contents present on the OSN through downloadable URLs or by:
aws s3 ls s3://TFusion/ --endpoint-url https://ncsa.osn.xsede.org/--no-sign-request
You can copy one specific orbit on the OSN to the current directory on your local machine using its URL via any data transferring tool such as wget, e.g., for Orbit 9972:
wget --input-file=https://ncsa.osn.xsede.org/TFusion/P124/TERRA_BF_L1B_O9972_20011102024622_F000_V001.h5
or by:
aws s3 cp s3://TFusion/P124/Terra_BF_L1B_O9972_20011102024622_F000_V001.h5 • --endpoint-url https://ncsa.osn.xsede.org/ --no-sign-request
3. The entire 2.4 PB of Level 1 Terra Basic Fusion files (2000 – 2015) can also be found in a private AWS bucket on glacier managed by NASA. It can be accessed with permission by contacting Prof. Di Girolamo.
4. The entire 2.4 PB of Level 1 Terra Basic Fusion files (2000 – 2015) can also be found at NCSA. It can be accessed with permission by contacting Prof. Di Girolamo.
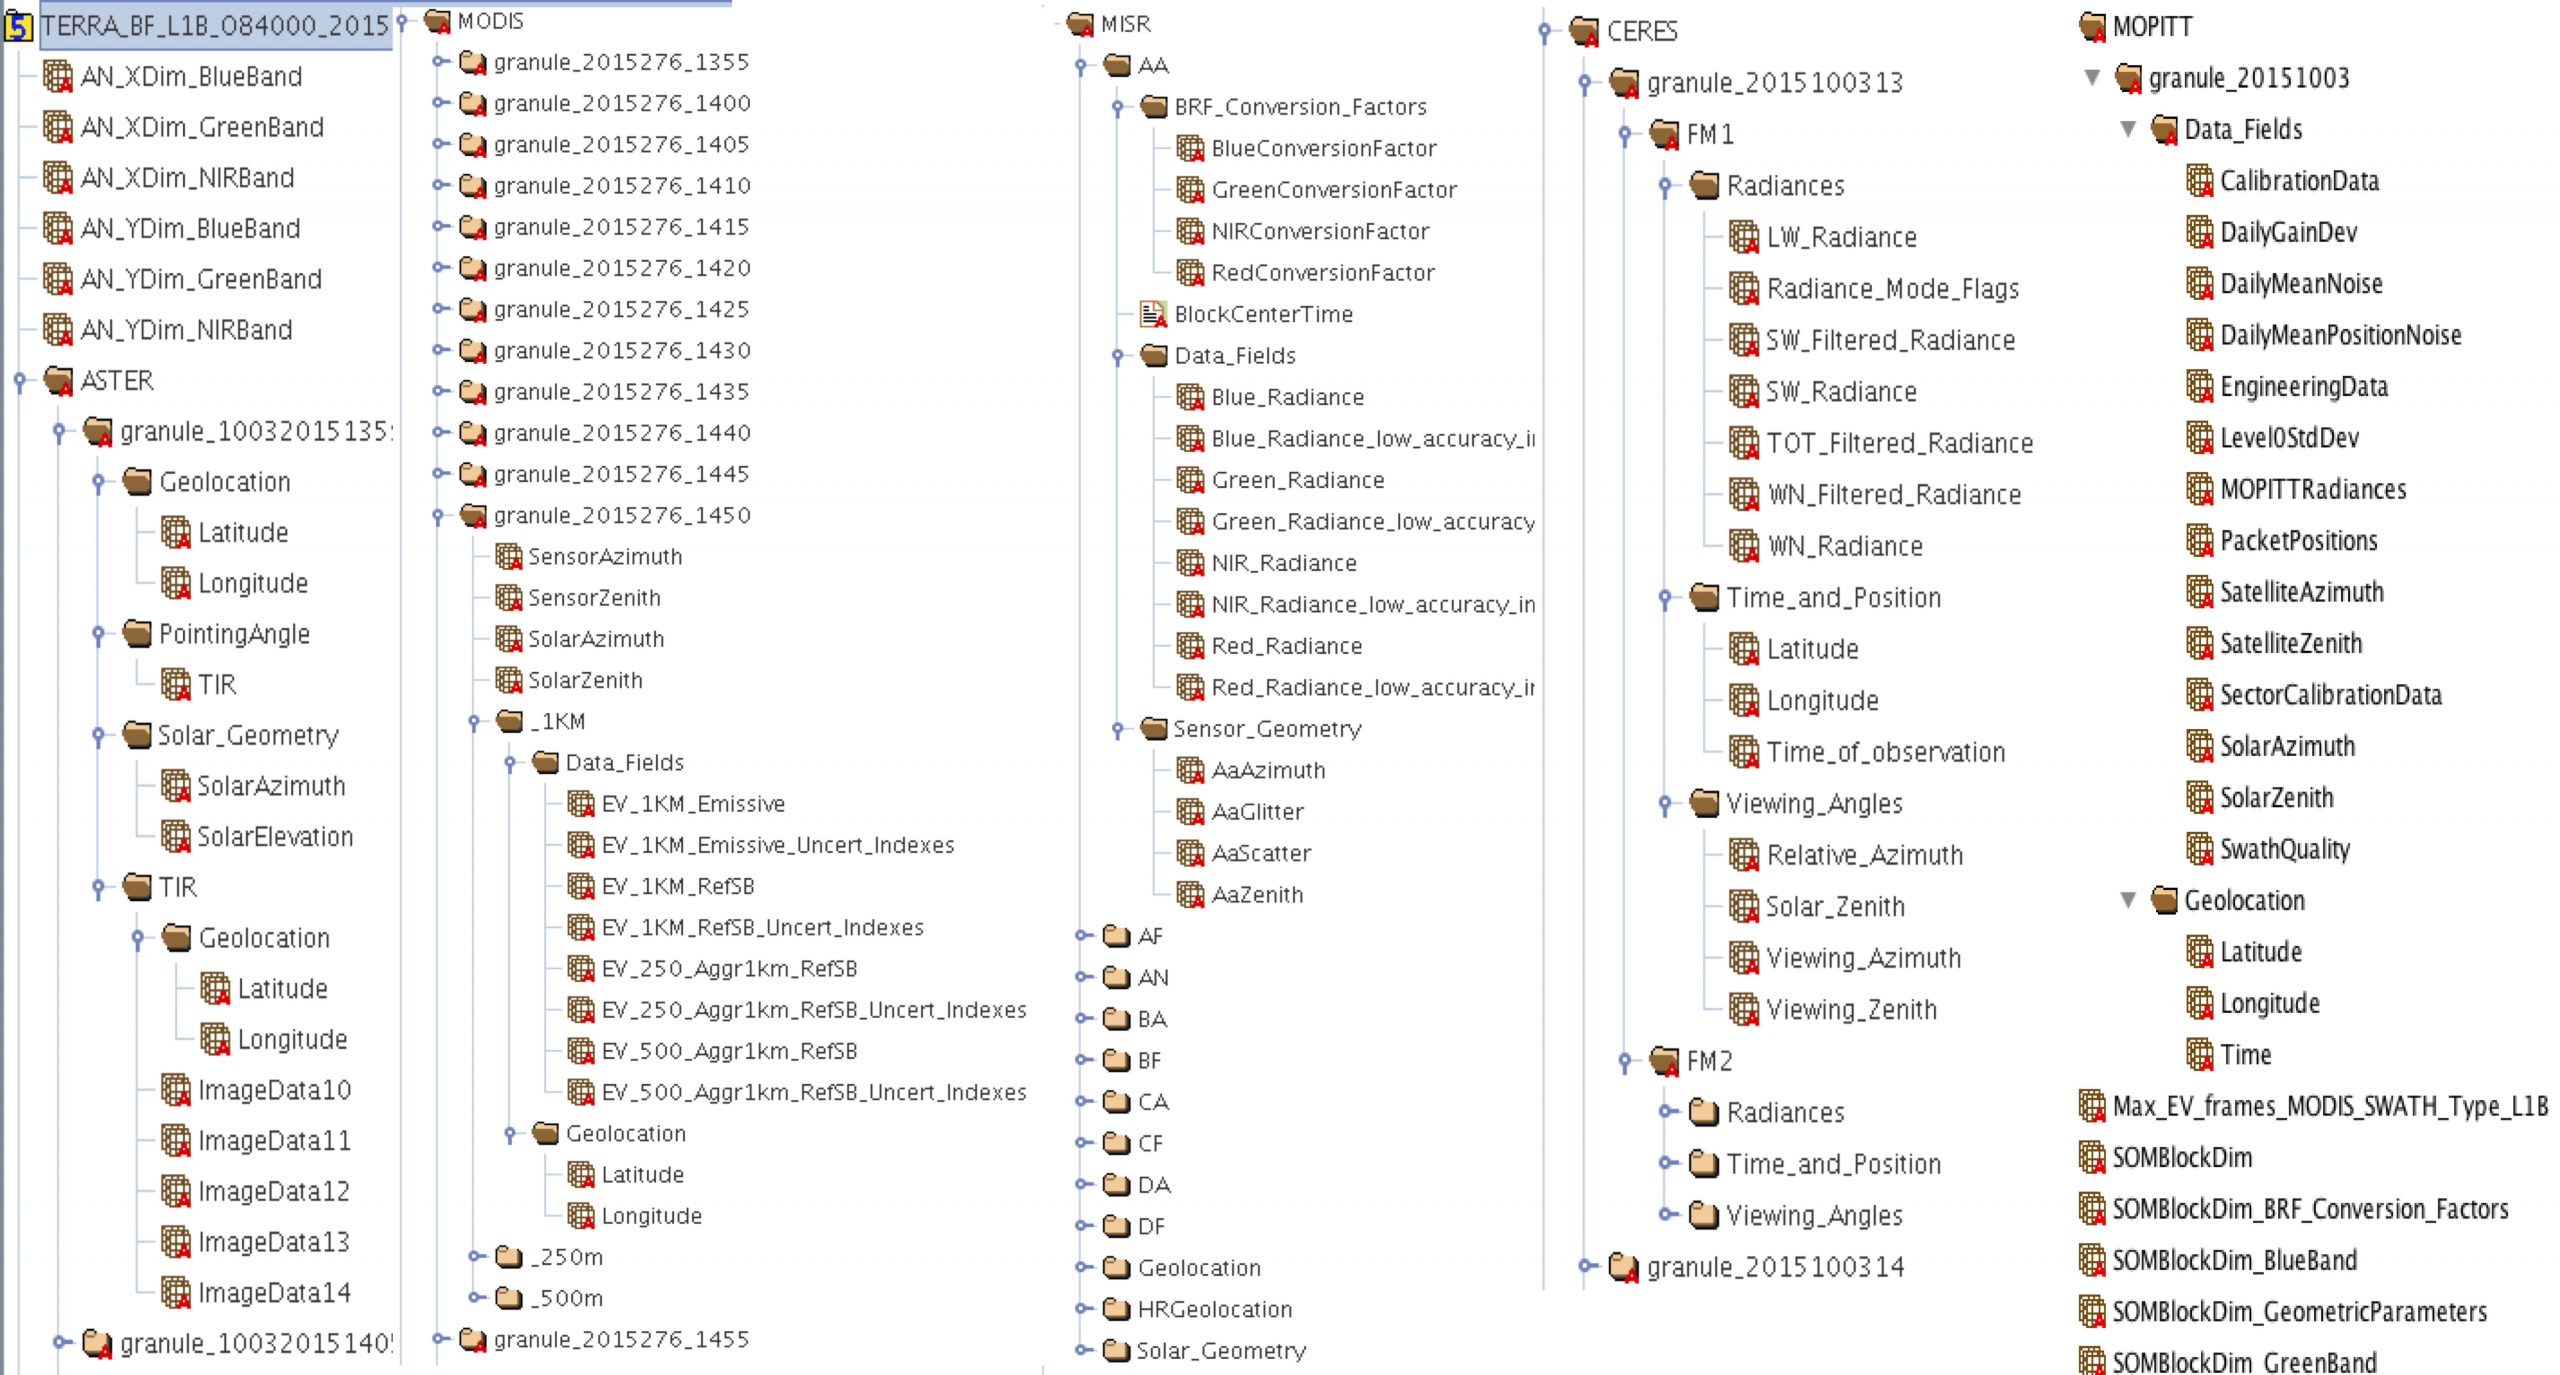
The Level 1 Terra Basic fusion files have been extensively validated to contain the original Terra instrument Level 1 data. If you are using HDFView, you can expect to see something like the following screen shot:
Software Tools
We have also developed several tools and documentation that are publicly available on our project’s GitHub.
BasicFusion:
This is the code used to develop the Level 1 Terra Basic Fusion files. As time goes by and updates to original Level 1 files occur and the mission continues, this code can be used to provide up-to-date Level 1 Terra Basic Fusion files.
AdvancedFusion:
TheAdvanced Fusion Tool (AFT) was developed as a community, open source tool to resample/reproject radiance fields for one Terra instrument onto the grid used by another Terra instrument, a regularly spaced grid, or any other user specified grid. It allows for any user-specified GDAL-supported map projections, and provides outputs in HDF5 and GeoTIFF. Resampling is done using a home-grown, highly-efficient and novel block indexing algorithm implemented in C.
PYTAF:
PYTAF is a user-friendly python interface built upon the AFT resampling core functions and can be applied to many other Earth observation datasets (Zhao et al. 2020).
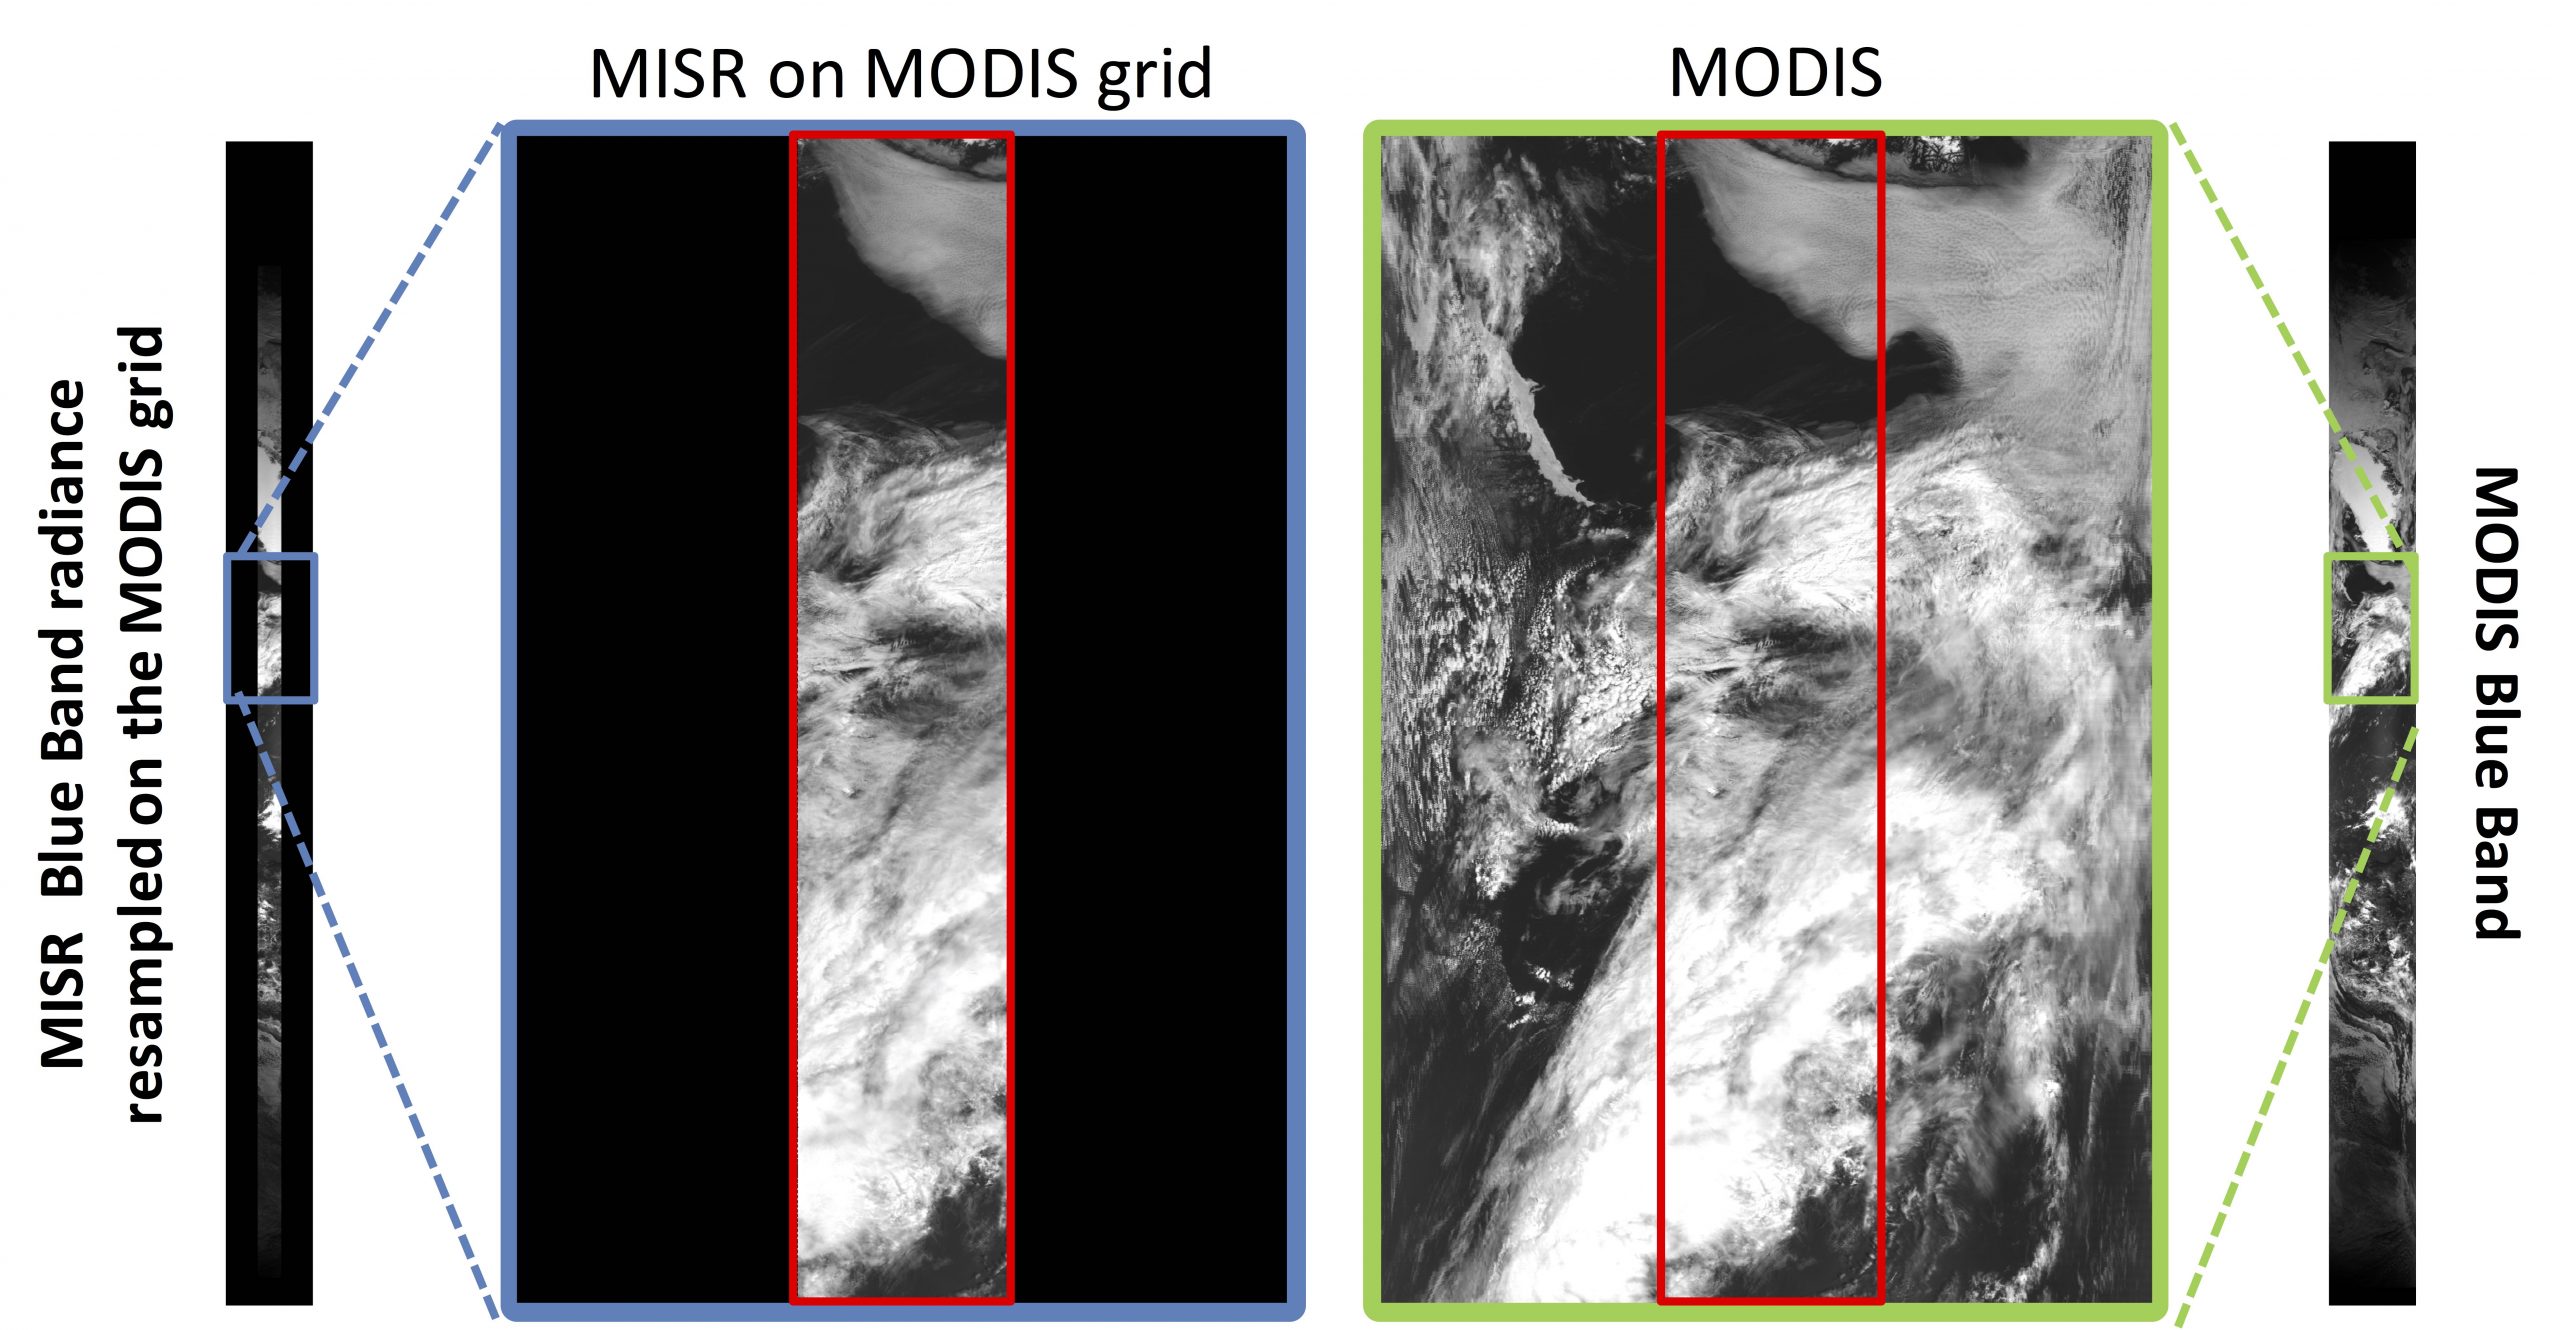
The above figure is simply an example of resampling the full-orbit MISR blue-band radiance contained in TERRA_BF_L1B_O71826_20130619141817_F000_V001.h5 onto the MODIS grid. For comparison, the MODIS blue band data is shown on the right-half of the figure. Using our highly-efficient and novel block indexing algorithm of AFT, it took 40 s to resample MISR 1.1km radiance toMODIS 1.0 km grid for the entire orbit using 16 cores on one Blue Waters node. The long strips of data to the far left and right of the image stretches from about the South Pole to the North Pole, with Greenland being easy to identify in the MODIS Blue Band wide swath image.
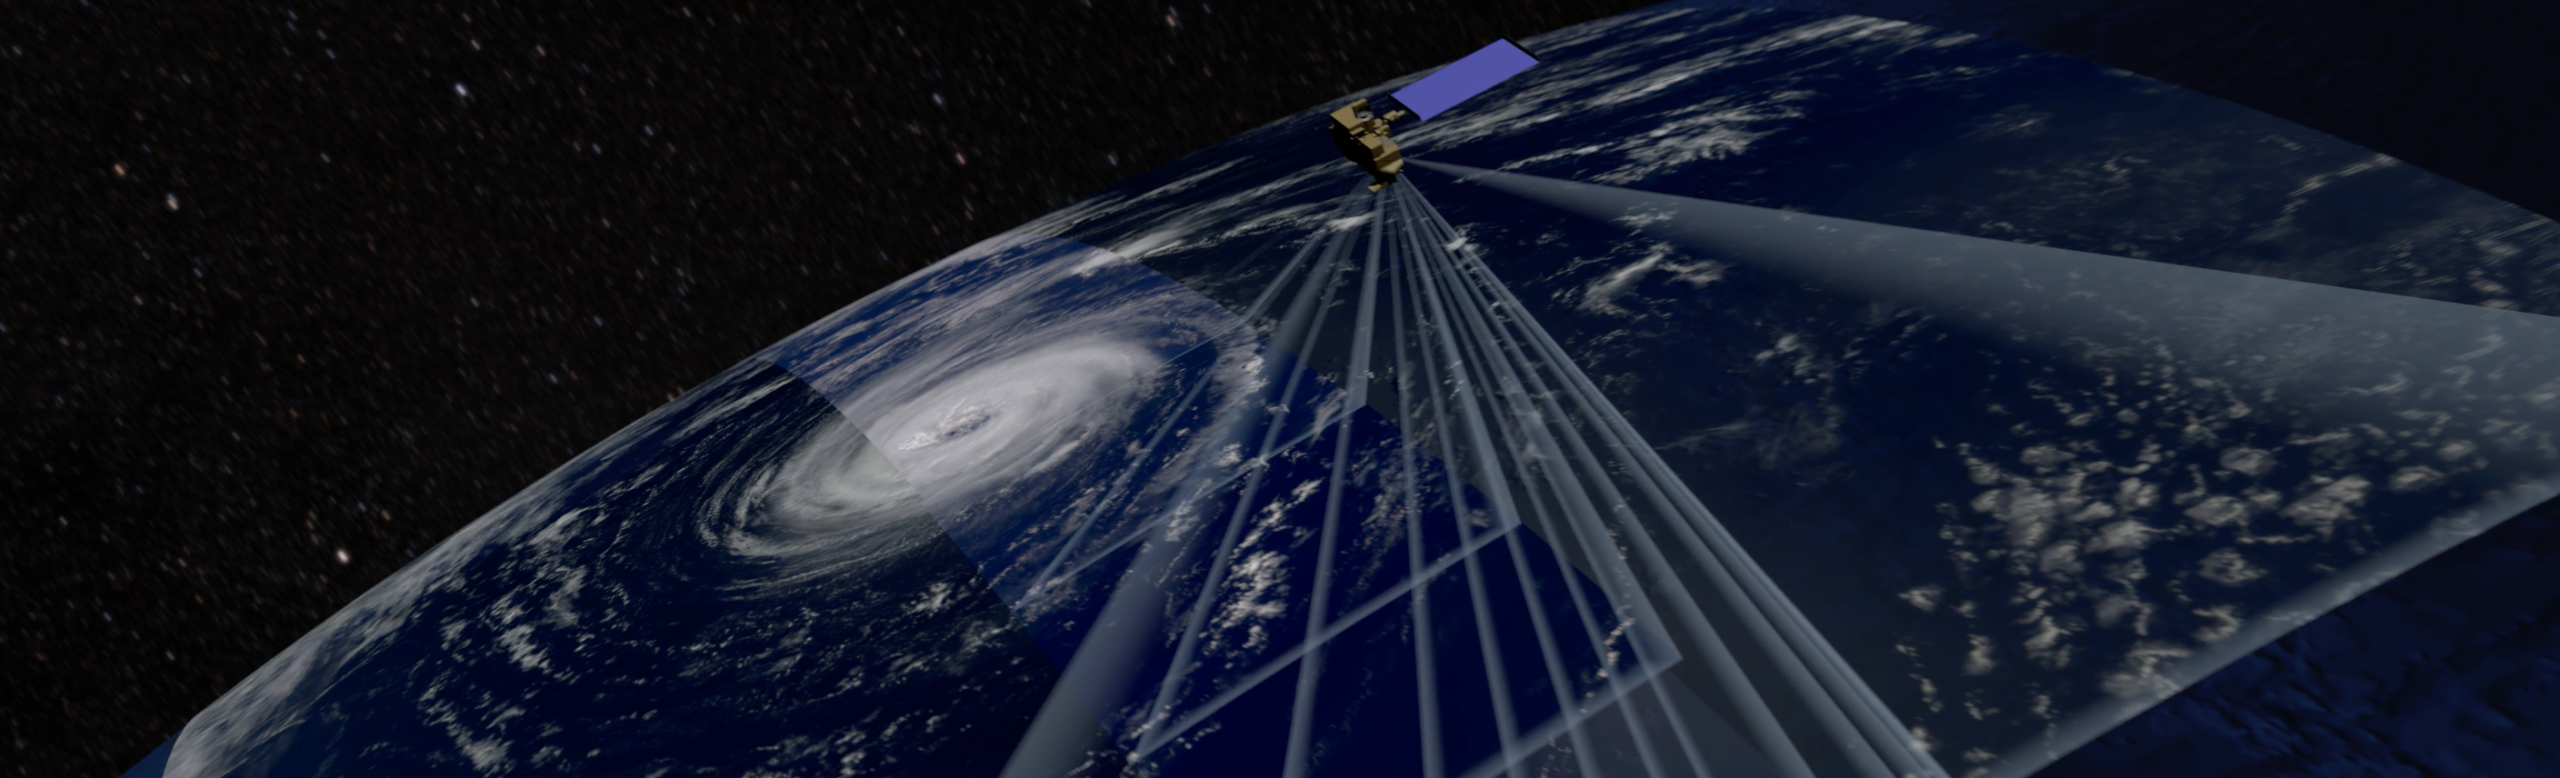
This video showcases how the five Terra instruments (MODIS, MISR, ASTER, MOPITT and CERES) sample the Earth. It was develop using radiance, time, geolocation, and viewing geometry stored in the Terra Basic Fusion product, with the opening scenes from TERRA_BF_L1B_O3571_20000819133750_F000_V001.h5 and the closing scenes from TERRA_BF_L1B_O2569_20000611181603_F000_V001.h5
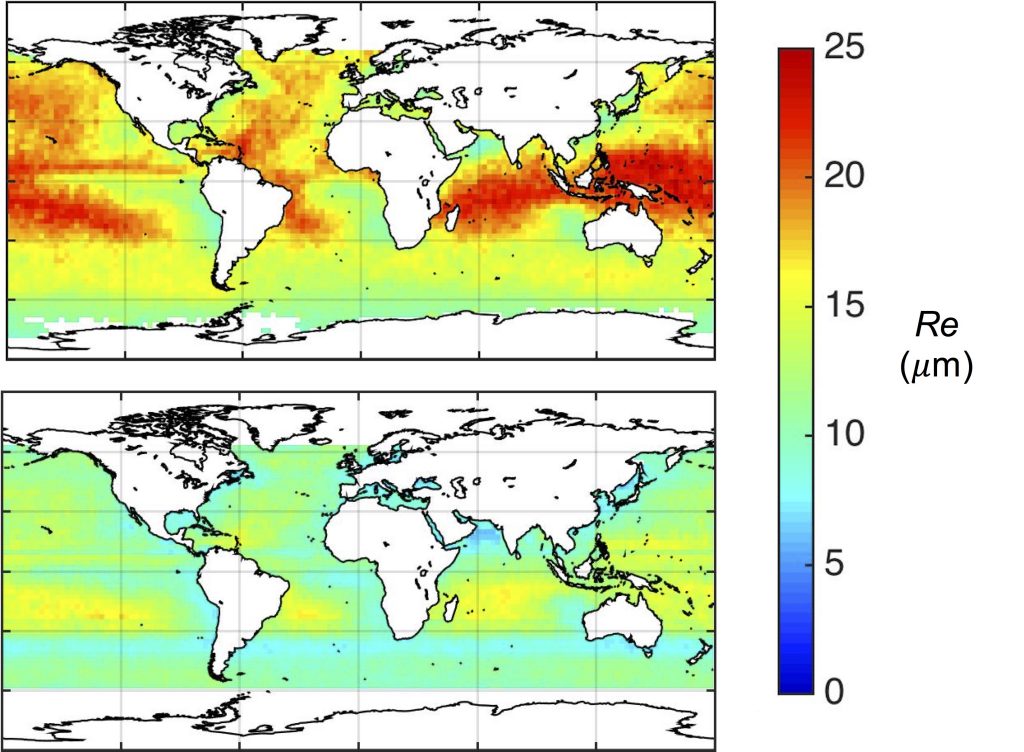
Our groups publications contains numerous examples in which multiple Terra instruments were used in various investigations. One of our recent papers (Fu et al., 2019) show the large improvements had in characterizing the effective radius (Re) in cloud drop size distribution by combining MODIS and MISR data. The top panel below shows the January (2000-2008) monthly mean Re from the original MODIS product sampled to the MISR swath; the bottom panel shows the January (2000-2008) monthly mean Re using an approach that fuses MISR and MODIS data.
Acknowledgments
This project was funded by the National Aeronautics and Space Administration (NASA) through contract number NNX13AL96G via the ACCESS program. This work was also supported in part by the Blue Waters sustained-petascalecomputing project, which is supported by the National Science Foundation (NSF) under Award OCI-0725070 and Award ACI-1238993, and in part by the State of Illinois, USA. Funding for science investigations using fused Terra datasets are listed in individual peer-reviewed publications below.
Peer-Reviewed Publications
This is the list of our group’s publications that have used data fusion (Level 1 or 2 or both) from two or more Terra instruments, whose efforts, in part, helped motivate and define the Terra Fusion project.
Mitra, A., L. Di Girolamo, Y. Hong, Y. Zhan, and K.J. Mueller, 2021: Assessment and error analysis of Terra-MODIS and MISR cloud-top heights through comparison with ISS-CATS lidar. J. Geophys. Res. Atmos., 126, e2020JD034281. https://doi.org/10.1029/2020JD034281.
Dutta, S., L. Di Girolamo, S. Dey, Y. Zhan, C.M. Moroney, and G. Zhao, 2020: The reduction in near-global cloud cover after correcting for biases caused by finite resolution measurement. Geophys. Res. Lett, 47, e2020GL090313. https://doi.org/10.1029/2020GL090313.
Zhao, G., M. Yang, Y. Gao, Y. Zhan, H.-K. Lee, and L. Di Girolamo, 2020: PYTAF: a python tool for spatially resampling Earth observation data. Earth Sci. Informatics, https://doi.org/10.1007/s12145-020-00461-w.
Fu, D., L. Di Girolamo, L. Liang, and G. Zhao, 2019: Regional Biases in Moderate Resolution Imaging Spectroradiometer (MODIS) marine liquid water cloud drop effective radius deduced through fusion with Multi-angle Imaging SpectroRadiometer (MISR). J. Geophys. Res. Atmos., 124, https://doi.org/10.1029/2019JD031063.
Wang, Y., P. Yang, S. Hioki, M.D. King, B.A. Baum, L. Di Girolamo, D. Fu, 2019: Ice cloud optical thickness, effective radius, and ice water path inferred from fused MISR and MODIS measurements based on a pixel-level optimal ice particle roughness model. J. Geophys. Res. Atmos., 124, https://doi.org/10.1029/2019JD030457.
Fromm, M., D. Peterson, and L. Di Girolamo, 2019: The primary convective pathway for observed wildfire emissions in the upper troposphere and lower stratosphere: a targeted reinterpretation. J. Geophys. Res. Atmos., 124. https://doi.ord/10.1029/2019JD031006.
Wang, Y., S. Hioki, P. Yang, M.D King, L. Di Girolamo, D. Fu, and B.A. Baum, 2018: Inference of an optimal ice particle model through latitudinal analysis of MISR and MODIS data. Remote Sens. 10(12), 1981, doi:10.3390/rs10121981.
Zhan, Y., L. Di Girolamo, R. Davies, and C. Moroney, 2018: Instantaneous top-of-atmosphere albedo comparison between CERES and MISR over the Arctic. Remote Sens. 10(12), 1882, doi:10.3390/rs10121882.
Werner, F., Z. Zhang, G. Wind, D. Miller, S. Platnick, and L. Di Girolamo, 2018: Improving cloud optical property retrievals for partly cloudy pixels using coincident higher-resolution single band measurements: A feasibility study using ASTER observations. J. Geophys. Res. Atmos. 123doi:10.1029/2018JD028902. (EOS Dec 5, 2018, Editor’s Highlight)
Mueller, K.J., D.L. Wu, A. Horvath, V.M. Jovanovic, J.-P. Mueller, L. Di Girolamo, M.J. Garay,D.J. Diner, C.M. Moroney, and S. Wanzong, 2017: Assessment of MISR Cloud Motion Vectors (CMVs) relative to GOES and MODIS Atmospheric Motion Vectors (AMVs). J. Appl. Meteor. Climatol., 56(3), 555-572, doi: 101175/JAMC-D-16-0112.1.
Werner, F., G. Wind, Z. Zhang, S. Platnick, L. Di Girolamo, G. Zhao, N. Amarasinghe, and K. Meyer, 2016: Marine boundary layer cloud property retrievals from high–resolution ASTER observations: case studies and comparison with Terra MODIS. Atmos. Meas. Tech., 9, 5869-5894, 2016; doi:10.5194/amt-9-5869-2016.
Liang, L. L. Di Girolamo, and W. Sun, 2015: Bias in MODIS cloud drop effective radius for oceanic water clouds as deduced from optical thickness variability across scattering angle. J. Geophys. Res. Atmos., 120, doi:10.1002/2015JD023256.
Stubenrauch, C.J., W.B. Rossow, S. Kinne, S. Ackerman, G. Cesana, H. Chepfer, L. Di Girolamo, B. Getzewich, A. Guignard, A. Heidinger, B. Maddux, P. Menzel, P. Minnis, C. Pearl, S. Platnick, C. Poulsen, J. Riedi, S. Sun-Mack, A. Walther, D. Winker, S. Zeng, and G. Zhao, 2013: Assessment of global cloud datasets from satellites: Project and Database initiated by the GEWEX Radiation Panel. Bull. Am. Meteor. Soc., 94, 1031 – 1049.
Liang, L., and L. Di Girolamo, 2013: A global analysis on the view-angle dependence of plane-parallel oceanic water cloud optical thickness using data synergy from MISR and MODIS. J. Geophys. Res. Atmos., 118, doi:10.1029/2012JD018201.
Reid, J.S., E.J. Hyer, R. Johnson, B.N. Holben, J. Zhang, J.R. Campbell, S.A. Christopher, L. Di Girolamo, L. Giglio, R.E. Holz, C. Kearney, J. Miettinen, E.A. Reid, F.J. Turk, J. Wang, P. Xian, R.J. Yokelson, G. Zhao, R. Balasubramanian, B.N. Chew, S. Janai, N. Lagrosas, P. Lestari, N.-H.Lin, M. Mahmud, B. Norris, A.X. Nguyen, N.T.K.Oahn, M. Oo, S. Salinas, and S.C. Liew, 2013: Observing and understanding the Southeast Asian aerosol system by remote sensing: An initial review and analysis for the Seven Southeast Asian Studies (7SEAS) program. Atmos. Res., 122, 403-468
Dey, S., L. Di Girolamo, G. Zhao, A.L. Jones, and G.M. McFarquhar, 2011: Satellite-observed relationships between aerosol and trade-wind cumulus cloud properties over the Indian Ocean. Geophys. Res. Lett., 38, L01804, doi:10.1029/2010GL045588.
Di Girolamo, L., L. Liang, and S. Platnick, 2010: A global view of one-dimensional solar radiative transfer through oceanic water clouds. Geophys. Res. Lett., 37, L18809, doi:10.1029/2010GL044094.
Zhao, G., L. Di Girolamo, S. Dey, A.L. Jones, and M. Bull, 2009: Examination of direct cumulus contamination on MISR-retrieved aerosol optical depth and angstrom coefficient over ocean. Geophys. Res. Lett., 36, L13811, doi:10.1029/2009GL038549.
Liang, L., L. Di Girolamo, and S. Platnick, 2009: View-angle consistency in reflectance, optical thickness and spherical albedo of marine water-clouds over the northeastern Pacific through MISR-MODIS fusion. Geophys. Res. Lett., 36, L09811, doi:10.1029/2008GL037124.
Harshvardhan, G. Zhao, L. Di Girolamo, and R.N. Green, 2009: Satellite-observed location of stratocumulus cloud-top heights in the presence of strong inversions. IEEE Trans. Geosci. Remote Sens., 47, 1421-1428.
Genkova, I., G. Seiz, G. Zhao, P. Zuidema, and L. Di Girolamo, 2007: Trade wind cumulus cloud top height comparisons from ASTER, MISR, and MODIS. Remote Sens. Environ.,107, 211-222.
Zhao, G., and L. Di Girolamo, 2006: Cloud fraction errors for trade wind cumuli from EOS-Terra instruments. Geophys. Res. Lett.,33, L20802, doi:10.1029/2006GL027088